A Brief Overview of Analysis of Molecular Variance
Analysis of Molecular Variance (AMOVA) is a statistical method used extensively in molecular ecology to quantify genetic variation within and among populations. Developed by Laurent Excoffier in the early 1990s, AMOVA allows researchers to partition genetic diversity at multiple hierarchical levels, such as within individuals, among individuals within populations, and among populations themselves. It is important to have a rudimentary understanding of this analysis as we will be using it in lab. AMOVA is based on the premise that genetic variation can be dissected into components corresponding to different levels of biological organization. By comparing genetic sequences or allele frequencies across these levels, AMOVA calculates the proportion of total genetic variation attributable to each level. This partitioning is crucial for understanding the distribution of genetic diversity and the processes driving population structure.
Methodology
- Data Input: AMOVA typically uses molecular data, such as DNA sequences, microsatellite genotypes, or single nucleotide polymorphisms (SNPs). The input data are arranged according to the levels of hierarchical structure being studied.
- Distance Calculations: AMOVA computes genetic distances or dissimilarities between all pairs of individuals or haplotypes, often using measures like F-statistics, which are based on Wright’s F-statistics concept.
- Variance Partitioning: The total genetic variance is partitioned into components. For a simple two-level hierarchy (within and among populations), AMOVA calculates FST, analogous to Wright’s FST, to measure genetic differentiation among populations. For more complex structures, AMOVA can compute FSC (among groups within populations) and FCT (among groups).
- Statistical Significance: To assess the significance of the variance components, AMOVA typically uses permutation tests, randomly reallocating individuals or haplotypes to different groups and recalculating the variance components to create a distribution against which observed values can be tested.
AMOVA is instrumental in various research scenarios in molecular ecology:
- Population Structure Analysis: By quantifying the proportion of genetic variance at different hierarchical levels, AMOVA helps in detecting and describing the genetic structure of populations and species. It can reveal whether genetic differentiation is primarily within populations, among populations, or among groups of populations.
- Conservation Genetics: AMOVA informs conservation strategies by identifying the main sources of genetic diversity. If most genetic variation is within populations, strategies might focus on protecting many small populations; if among populations, preserving genetic exchange and connectivity becomes crucial.
- Phylogeography and Historical Demography: AMOVA can elucidate historical processes, such as migration, isolation, or expansion, by showing how genetic diversity is partitioned across landscapes or among lineages over time.
Wright’s Fixation Index (FST)
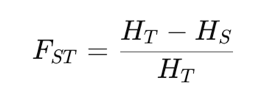
Wright’s Fixation Index, FST , compares the genetic diversity observed within individual subpopulations to the total genetic diversity observed across all subpopulations. Essentially, it measures the proportion of genetic variance that can be attributed to differences among subpopulations. The value of FST ranges from 0 to 1, where 0 indicates no differentiation, meaning the subpopulations are genetically indistinguishable and share the same allele frequencies and 1 indicates complete differentiation, where the subpopulations are completely distinct, with no shared alleles. To calculate FST, researchers typically use allele frequency data from multiple loci across the subpopulations. The formula involves computing the average heterozygosity within subpopulations (often referred to as HS) and the total heterozygosity across the entire population (HT). The equation is:
EXAMPLE: Calculate genetic differentiation (FST) between the following two population:
Population 1 (Pop1):
Frequency of allele A (p1): 0.7
Frequency of allele a (q1): 0.3
Population 2 (Pop2):
Frequency of allele A (p2): 0.4
Frequency of allele a (q2): 0.6
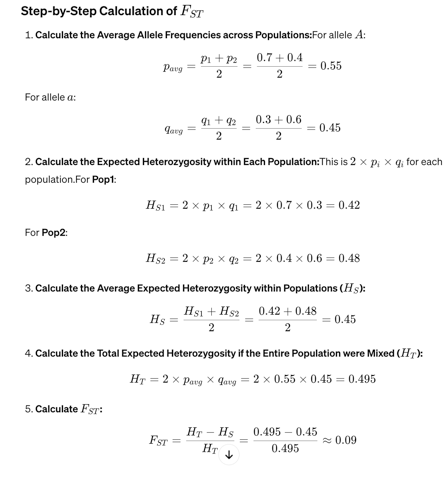
An FST value of 0.09 suggests that there is a moderate level of genetic differentiation between these two populations.
Media Attributions
- FST
- solution
